List of countries by proven oil reserves
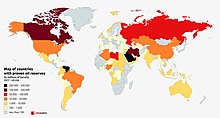


Proven oil reserves are those quantities of petroleum which, by analysis of geological and engineering data, can be estimated, with a high degree of confidence, to be commercially recoverable from a given date forward from known reservoirs and under current economic conditions.
Some statistics on this page are disputed and controversial—different sources (OPEC, CIA World Factbook, oil companies) give different figures. Some of the differences reflect different types of oil included. Different estimates may or may not include oil shale, mined oil sands or natural gas liquids.
Because proven reserves include oil recoverable under current economic conditions, nations may see large increases in proven reserves when known, but previously uneconomic deposits become economic to develop. In this way, Canada's proven reserves increased suddenly in 2003 when the oil sands of Alberta were seen to be economically viable. Similarly, Venezuela's proven reserves jumped in the late 2000s when the heavy oil of the Orinoco Belt was judged economic.
Sources
Sources sometimes differ on the volume of proven oil reserves. The differences sometimes result from different classes of oil included, and sometimes result from different definitions of proven. (The data below does not seem to include shale oil and other "unconventional" sources of oil such as tar sands. For instance, North America has over 3 trillion barrels of shale oil reserves,[citation needed] and the majority of oil produced in the USA is from shale, leading to the paradoxical data below that the USA will finish all its oil at current production in 11 years, because the production is mostly from shale but the reserves cited omit all shale reserves.)
Comparison of proven oil reserves from some widely used sources (billions of barrels, as of 31 Dec 2014)
| Source | Canada | Iran | Iraq | Russia | Saudi Arabia | United States | Venezuela |
|---|---|---|---|---|---|---|---|
| BP[1] | 172.9 | 157.8 | 143 | 103.2 | 267.0 | 48.5 | 298.3 |
| OPEC[2] | 4.2 | 157.5 | 147.2 | 80.0 | 266.6 | 36.5 | 300.0 |
| US CIA[3] | 171.0 | 157.8 | 147 | 103.2 | 268.3 | 36.5 | 298.4 |
| US EIA[4] | 172.5 | 157.8 | 145 | 80.0 | 268.3 | 39.9 | 298.4 |
Countries
Reserves amounts are listed in millions of barrels. .00
| Country | US EIA [5] | OPEC [6] | BP [7] | Others | Oil production December 2023 (bbl/day)[8] | Years of production in reserve |
|---|---|---|---|---|---|---|
 Venezuela *(OPEC) Venezuela *(OPEC) | 304,000 | 303,220 | 303,800 | 770,000 | 1,000 | |
 Saudi Arabia *(OPEC) Saudi Arabia *(OPEC) | 259,000.00 | 266,260 | 297,600 | 8,950,000 | 65.4 | |
 Iran *(OPEC) Iran *(OPEC) | 209,000.00 | [9] 208,600 | 155,600 | 4,084,000 | 163 | |
 Canada * Canada * | 170,000.00 | 4,421 | 172,200 | [10] 171,000 | 4,971,000 | 82 |
 Iraq *(OPEC) Iraq *(OPEC) | 145,000.00 | 147,223 | 145,000 | 4,375,000 | 94.8 | |
 Kuwait *(OPEC) Kuwait *(OPEC) | 102,000.00 | 104,000 | 104,000 | 2,644,000 | 103 | |
 United Arab Emirates *(OPEC) United Arab Emirates *(OPEC) | 98,000.00 | 113,000 | 111,000 | 3,300,000 | 74 | |
 Russia * Russia * | 80,000 | 99,000 | 107,800 | 10,126,000 | 20 | |
 Libya *(OPEC) Libya *(OPEC) | 48,000.00 | 74,363 | 78,400 | 1,248,000 | 110 | |
 United States * United States * | 48,300[11].00 | 32,773 | 68,800 | [12] 43,629 | 13,295,000 | 6.3 |
 Nigeria *(OPEC) Nigeria *(OPEC) | 37,000.00 | 37,453 | 37,100 | 1,573,000 | 60 | |
 Kazakhstan * Kazakhstan * | 30,000.00 | 30,000 | 30,000 | 1,897,000 | 40 | |
 China * China * | 26,000.00 | 27,000 | 26,000 | 4,172,000 | 16 | |
 Qatar * Qatar * | 25,000.00 | 25,244 | 25,244 | 1,322,000 | 38 | |
 Brazil * Brazil * | 13,000.00 | 12,634 | 13,000 | [13]16,848 | 3,585,000 | 12 |
 Algeria *(OPEC) Algeria *(OPEC) | 12,000.00 | 12,200 | 12,200 | 1,160,000 | 24 | |
 Guyana * Guyana * | 11,000.00 | 11,000[14] | 555,000 | 200 | ||
 Namibia * Namibia * | 11,000[15][16] | |||||
 Ecuador Ecuador | 8,300.00 | 8,273 | 8,000 | 486,000 | 48 | |
| 8,100.00 | 6,376 | 8,500 | 1,894,000 | 11 | ||
 Angola * Angola * | 7,800.00 | 8,384 | 12,700 | 1,235,000 | 18 | |
 Azerbaijan * Azerbaijan * | 7,000.00 | 7,000 | 7,000 | 601,000 | 30 | |
 Suriname Suriname | 06,500[17] | 13,000 | 1,300 | |||
 Mexico * Mexico * | 5,800.00 | 6,537 | 10,800 | [18] 9.700 | 1,903,000 | 8.1 |
 Oman * Oman * | 5,400.00 | 5,373 | 5,300 | 1,040,000 | 15 | |
 India * India * | 4,600.00 | 4,495 | 5,680 | [12] 4,409 | 589,000 | 14 |
 Vietnam * Vietnam * | 4,400.00 | 4,400 | 4,000 | 165,000 | 59 | |
 South Sudan South Sudan | 3,800.00 | 160,000 | 68 | |||
 Malaysia * Malaysia * | 3,600.00 | 3,600 | 3,600 | [12] 5,542 | 525,000 | 19 |
 Egypt * Egypt * | 3,300.00 | 4,400 | 3,500 | 559,000 | 15 | |
 Yemen * Yemen * | 3,000.00 | 3,000 | 15,000 | 100 | ||
 Congo(OPEC) Congo(OPEC) | 2,900.00 | 1,811 | 2,900 | 253,000 | 29 | |
 United Kingdom * United Kingdom * | 2,500.00 | 2,069 | 2,800 | 2,618 | 647,000 | 7.4 |
 Syria * Syria * | 2,500.00 | 2,500 | 2,500 | 95,000 | 160 | |
 Uganda * Uganda * | 2,500.00 | |||||
 Argentina * Argentina * | 2,500.00 | 2,162 | 2,400 | [19]16,000 | 677,000 | 9.8 |
 Indonesia * Indonesia * | 2,500.00 | 3,310 | 3,600 | 3,497 | 605,000 | 8.0 |
 Australia * Australia * | 2,400.00 | 3,985 | 4,000 | 4,002 | 395,000 | 26 |
 Colombia * Colombia * | 2,000.00 | 1,665 | 2,300 | 787,000 | 7 | |
 Gabon *(OPEC) Gabon *(OPEC) | 2,000.00 | 2,000 | 2,000 | 220,000 | 30 | |
 Chad * Chad * | 1,500.00 | 1,500 | 126,000 | 43 | ||
 Turkey * Turkey * | 1,400.00 | 1350 | 89,000 | 10 | ||
 Sudan * Sudan * | 1,300.00 | 5,000 | 1,500 | 71,000 | 56 | |
 Brunei * Brunei * | 1,100.00 | 1,100 | 1,100 | 100,000 | 32 | |
 Equatorial Guinea *(OPEC) Equatorial Guinea *(OPEC) | 1,100.00 | 1,100 | 1,100 | 79,000 | 21 | |
 Peru * Peru * | 900.00 | 1,400 | [12] 1,489 | 44,000 | 20 | |
 Kenya * Kenya * | .00 | 750 | ||||
 Ghana * Ghana * | 700.00 | 175,000 | 10 | |||
 Romania * Romania * | 600.00 | 600 | 57,000 | 20 | ||
 Turkmenistan * Turkmenistan * | 600.00 | 600 | 600 | 191,000 | 7 | |
 Uzbekistan * Uzbekistan * | 600.00 | 594 | 600 | 32,000 | 40 | |
 Pakistan * Pakistan * | 500.00 | [12] 236 | 83,000 | 10 | ||
 Italy * Italy * | 500.00 | 600 | [12] 595 | 119,000 | 9 | |
 Denmark * Denmark * | 400.00 | 439 | 600 | [12] 550 | 58,000 | 20 |
 Tunisia * Tunisia * | 400.00 | 400 | 33,000 | 30 | ||
 Ukraine * Ukraine * | 400.00 | 395 | 20 | |||
 Thailand * Thailand * | 300.00 | 400 | 136,000 | 2 | ||
 Trinidad and Tobago * Trinidad and Tobago * | 200.00 | 700 | [12] 830 | 54,000 | 7 | |
 Bolivia * Bolivia * | 200.00 | [12] 210 | 22,000 | 8 | ||
 Cameroon * Cameroon * | 200.00 | 49,000 | 8 | |||
 Belarus * Belarus * | 200.00 | 198 | 29,000 | 20 | ||
 Bahrain * Bahrain * | 200.00 | 167,000 | 3 | |||
 DR Congo DR Congo | 200.00 | 19,000 | 30 | |||
 Papua New Guinea * Papua New Guinea * | 200.00 | [12] 158 | 31,000 | 10 | ||
| 200.00 | 14,000 | 30 | ||||
 Chile * Chile * | 200.00 | 2,300 | 30 | |||
 Niger * Niger * | 200.00 | 6,000 | 40 | |||
 Spain * Spain * | 200.00 | 100 | 7 | |||
 Myanmar * Myanmar * | 100.00 | 7,100 | 30 | |||
 Philippines Philippines | 100.00 | 900 | 20 | |||
 Netherlands Netherlands | 100.00 | [12] 141 | 28,000 | 4 | ||
 Cuba * Cuba * | 100.00 | [12] 124 | 30,000 | 7 | ||
 Germany * Germany * | 100.00 | [12] 229 | 32,000 | 2 | ||
 Poland * Poland * | 100.00 | [12] 151 | 18,000 | 7 | ||
 Ivory Coast * Ivory Coast * | 100.00 | 29,000 | 9 | |||
 Guatemala Guatemala | 860 | 6,000 | 20 | |||
 Serbia * Serbia * | 770 | 13,000 | 12 | |||
 Croatia * Croatia * | 710 | 10,000 | 12 | |||
 France * France * | 610 | 12,000 | 2.7 | |||
 Japan * Japan * | 440 | 3,500 | 1.2 | |||
 New Zealand * New Zealand * | 400 | 11,000 | 5 | |||
 Kyrgyzstan * Kyrgyzstan * | 400 | 6,200 | 200 | |||
 Austria * Austria * | 350 | 8,800 | 3.8 | |||
 Georgia * Georgia * | 350 | 200 | 300 | |||
 Bangladesh * Bangladesh * | 280 | 3,000 | 5.9 | |||
 Mauritania * Mauritania * | 200 | |||||
 Bulgaria * Bulgaria * | 150 | 1,000 | 6.7 | |||
 Czech Republic * Czech Republic * | 150 | 15.0 | 1,400 | 4 | ||
 South Africa * South Africa * | 150 | 15 | 1,000 | 0.39 | ||
| 120 | [12] 12 | 15,000 | 5.7 | |||
 Hungary * Hungary * | 120 | [12] 35 | 20,000 | 0.84 | ||
 Lithuania * Lithuania * | 120 | 700 | 3.7 | |||
 Tajikistan * Tajikistan * | 120 | 300 | 100 | |||
 Greece * Greece * | 100 | 1,500 | 2 | |||
 Slovakia * Slovakia * | 9.00 | 100 | 4 | |||
 Benin * Benin * | 8.00 | |||||
 Belize * Belize * | 6.00 | 800 | 10 | |||
 Taiwan * Taiwan * | 2.00 | 200 | 0.2 | |||
 Barbados Barbados | 1.00 | 1,000 | 5 | |||
 Jordan * Jordan * | 1.00 | [12] 1 | 100 | 9 | ||
 Morocco * Morocco * | 0.6.00 | 100 | 10 | |||
 Ethiopia * Ethiopia * | 0.4.00 | |||||
| World | 1,703,000.00 | 1,535,773 | 1,750,600 | 8,29,39,300 | 50.06 |
* indicates "Oil reserves in COUNTRY or TERRITORY" or "Energy in COUNTRY or TERRITORY" links.
See also
- List of countries by oil production
- List of countries by oil consumption
- List of countries by natural gas proven reserves
References
- ^ BP Statistical Review of World Energy, 2015
- ^ OPEC Statistical Bulletin, 2015.
- ^ World Factbook, US Central Intelligence Agency, 2015.
- ^ "U.S. Crude Oil plus Lease Condensate Proved Reserves". www.eia.gov. Retrieved 13 June 2021.
- ^ "International - U.S. Energy Information Administration (EIA)". www.eia.gov. Retrieved 5 October 2023.
- ^ Economou, Andreas; Fattouh, Bassam (7 May 2021). "OPEC at 60: the world with and without OPEC". OPEC Energy Review. 45 (1): 3–28. Bibcode:2021OEnRv..45....3E. doi:10.1111/opec.12205. ISSN 1753-0229.
- ^ "Statistical Review of World Energy" (PDF). www.bp.com. 8 June 2016. Retrieved 23 October 2023.
- ^ "International - U.S. Energy Information Administration (EIA)". www.eia.gov. Retrieved 5 October 2023.
- ^ "OPEC : Iran". www.opec.org. Retrieved 13 June 2021.
- ^ Oil Resources, Natural Resources Canada, 16 Feb. 2,016.
- ^ "U.S. Crude Oil and Natural Gas Proved Reserves, Year-end 2022".April 29, 2024
- ^ a b c d e f g h i j k l m n o p q Reolon, Dario; Di Maggio, Federica; Moriggi, Sara; Galli, Giuseppe; Pirrone, Marco (24 June 2020). "Unlocking Data Analytics for the Automatic Evaluation of Cement Bond Scenarios". SPWLA 61st Annual Online Symposium Transactions. Society of Petrophysicists and Well Log Analysts. doi:10.30632/spwla-5060. S2CID 225718759.
- ^ Reolon, Dario; Di Maggio, Federica; Moriggi, Sara; Galli, Giuseppe; Pirrone, Marco (24 June 2020). "Unlocking Data Analytics for the Automatic Evaluation of Cement Bond Scenarios". SPWLA 61st Annual Online Symposium Transactions. Society of Petrophysicists and Well Log Analysts. doi:10.30632/spwla-5060. S2CID 225718759.
- ^ "Guyana scrambles to make the most of oil wealth". BBC News. 10 September 2023. Retrieved 3 December 2023.
- ^ "Namibia's offshore oil discoveries estimated at 11 bln barrels - NAMCOR". Reuters.
- ^ pedromedro (6 July 2011). "Namibia Sees 11 Billion Barrels In Offshore Oil Reserves". Eco (Atlantic) Oil & Gas Plc. Retrieved 21 December 2023.
- ^ OilNOW (5 August 2020). "Suriname's Block 58 could hold 6.5 billion barrels of oil – Morgan Stanley | OilNOW". Retrieved 26 September 2023.
- ^ www.pemex.com http://www.pemex.com/.../Reservas%2520de%2520Hidrocarburos%2520Archivos/. Retrieved 13 June 2021.
{{cite web}}: Missing or empty|title=(help) - ^ "Argentina's Oil Industry is Finally Bouncing Back".
- v
- t
- e
| Petroleum |
|
|---|---|
| Natural gas | |
| Coal |
| Uranium | |
|---|---|
| Thorium |


